Industry and Market Structure
The natural gas industry is an extremely important segment of the U.S. economy. In addition to providing one of the cleanest burning fuels available to all segments of the economy, the industry itself provides much valuable commerce to the U.S. economy. Below is a brief description of the structure of the natural gas industry and market, as well as links to information on the make-up of the various segments of the natural gas industry, and recent statistics regarding the supply of natural gas. To learn about the processes associated with the natural gas supply chain, click here.
To jump ahead to specific topics in this section, click on the links below:
- Overview of Industry Structure – discusses how different market participants interact to bring supplies of natural gas to the market.
- Industry Makeup – discusses the composition of the industry.
- Natural Gas Market Overview – discusses the natural gas market, and the forces that affect the interaction of supply and demand for natural gas
.
- Market Activity -provides a snapshot of recent wholesale market activity as reported by various indices and platforms.
Overview of Industry Structure
The structure of the natural gas industry has changed dramatically since the mid-1980’s. In the past, the structure of the natural gas industry was simple, with limited flexibility and few options for natural gas delivery. Exploration and production companies explored and drilled for natural gas, selling their product at the wellhead to large transportation pipelines. These pipelines transported the natural gas, selling it to local distribution utilities, who in turn distributed and sold that gas to its customers. The prices for which producers could sell natural gas to transportation pipelines was federally regulated, as was the price at which pipelines could sell to local distribution companies. State regulation monitored the price at which local distribution companies could sell natural gas to their customers.
Getting Natural Gas to Market – Prior to Deregulation and Pipeline Unbundling
 |
| Source: NGSA |
Thus, the structure of the natural gas industry prior to deregulation and pipeline unbundling was very straightforward. However, with regulation of wellhead prices, as well as assured monopolies for large transportation pipelines and distribution companies, there was little competition in the marketplace, and incentives to improve service and innovate were few. Regulation of the industry also led to natural gas shortages in the 1970s, and surpluses in the 1980s. To review the history of natural gas regulation, click here.
The natural gas industry today has changed dramatically, and is much more open to competition and choice. Wellhead prices are no longer regulated; meaning the price of natural gas is dependent on supply and demand interactions. Interstate pipelines no longer take ownership of the natural gas commodity; instead they offer only the transportation component, which is still under federal regulation. LDCs continue to offer bundled products to their customers, although retail unbundling taking place in many states allows the use of their distribution network for the transportation component alone. End users may purchase natural gas directly from producers or LDCs.
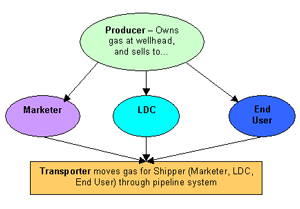
One of the primary differences in the current structure of the market is the existence of natural gas marketers. Marketers serve to facilitate the movement of natural gas from the producer to the end user. Essentially, marketers can serve as a middle-man between any two parties, and can offer either bundled or unbundled service to its customers. Thus, in the structure mentioned above, marketers may be present between any two parties to facilitate the sale or purchase of natural gas, and can also contract for transportation and storage. Marketers may own the natural gas being transferred, or may simply facilitate its transportation and storage. Essentially, a myriad of different ownership pathways exist for natural gas to proceed from producer to end user.
Simplified Structure of Industry after Pipeline Unbundling
 |
| Source: NGSA |
The diagram shows a simplified representation of the structure of the natural gas industry after pipeline unbundling and wellhead price deregulation. It is important to note that the actual ownership pathway of the gas may be significantly more complicated, as the marketer or the LDC are not the final users. Either of these two entities may sell directly to the end user, or to other marketers or LDCs.
The regulatory environment of the day has a dramatic effect on shaping the structure of the industry. To learn more about the current regulatory environment for the natural gas industry, click here.
The actions of the federal government and its related agencies and departments can also have a significant impact on the structure and functioning of the natural gas industry. To learn more about how government actions can affect the natural gas industry, click here.
 |
| Source: NGSA |
Now that the basic structure of the natural gas industry has been discussed, it is possible to examine the business characteristics and relevant statistics of each industry segment.
An excellent source for statistics and information on the natural gas industry and its various sectors is the Energy Information Administration (EIA). The EIA was created in 1977 as the statistical arm of the Department of Energy, charged with developing energy data and analyses that help to enhance the understanding of the energy industry. Click here to view the EIA’s homepage. For a good overview of relevant updated statistics related to the natural gas industry, view the EIA’s summary statistics on natural gas here.
Below are some statistics (based on EIA data for the year 2007) on the makeup of the natural gas industry. Follow the links to view the most up to date information on each sector:
- Producers – There are over 6,300 producers of natural gas in the United States. These companies range from large integrated producers with worldwide operations and interests in all segments of the oil and gas industry, to small one or two person operations that may only have partial interest in a single well. The largest integrated production companies are termed ‘Majors’, of which there are 21 active in the United States. For more information on the production of natural gas in the United States, click here. Information on the production of natural gas is also available on EIA’s website here.
- Processing – There are over 530 natural gas processing plants in the United States, which were responsible for processing almost 15 trillion cubic feet of natural gas and extracting over 630 million barrels of natural gas liquids in 2006. For more information on natural gas processing, visit the Gas Processors Association here. For updated statistics on the processing of natural gas in the United States, click here.
- Pipelines – There are about 160 pipeline companies in the United States, operating over 300,000 miles of pipe. Of this, 180,000 miles consist of interstate pipelines. This pipeline capacity is capable of transporting over 148 Billion cubic feet (Bcf) of gas per day from producing regions to consuming regions. For more information on the natural gas pipeline infrastructure in the United States, click here. To see a list of major pipeline companies, including links to their websites, visit the Federal Energy Regulatory Commission’s website here.
- Storage – There are about 123 natural gas storage operators in the United States, which control approximately 400 underground storage facilities. These facilities have a storage capacity of 4,059 Bcf of natural gas, and an average daily deliverability of 85 Bcf per day. The EIA maintains a weekly storage survey, monitoring the injection and withdrawal of stored natural gas. This survey gives a good indication of the status of the natural gas market, measuring the natural gas that is extracted or stored at any one time in response to the demand for natural gas. To learn more about this survey, visit the EIA here. To view more statistics and information related to natural gas storage in the United States, click here.
- Marketing – The status of the natural gas marketing segment of the industry is constantly changing, as companies enter and exit from the industry quite frequently. As of 2000, there were over 260 companies involved in the marketing of natural gas. In this same year, about 80 percent of all the natural gas supplied and consumed in North America passed through the hands of natural gas marketers. The volume of non-physical natural gas that passes through the hands of marketers is very large, and can be much greater than the actual physical volume consumed. This is an indication of vibrant, transparent commodity markets for natural gas. For instance, in 1998, it is estimated that for every thousand cubic feet of natural gas consumed, about 2.7 thousand cubic feet passed through natural gas marketers. For more information on natural gas and energy marketers, visit the National Energy Marketers Association here.
- Local Distribution Companies – There are about 1,200 natural gas distribution companies in the U.S., with ownership of over 1.2 million miles of distribution pipe. While many of these companies maintain monopoly status over their distribution region, many states are currently in the process of offering consumer choice options with respect to their natural gas distribution. To learn about the status of distribution restructuring across the United States visit the EIA here. To learn more about natural gas distribution companies and their regulatory structure, visit the National Association of Regulatory Utility Commissioners here. The American Gas Association is also an excellent source for information on LDCs.
The nature of the natural gas market is similar to other competitive commodity markets: prices reflect the ability of supply to meet demand at any one time. The economics of producing natural gas are relatively straightforward. Like any other commodity, the price of natural gas is largely a function of demand and the supply of the product.
 |
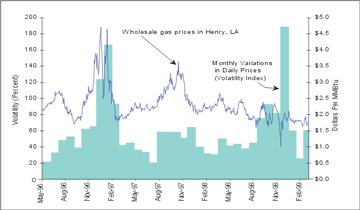
| Natural Gas Volatility and Price Levels at Henry Hub |
| Source: Energy Information Administration, Office of Oil and Gas; based on Natural Gas Monthly publications |
When demand for gas is rising, and prices rise accordingly, producers will respond by increasing their exploration and production capabilities. As a consequence, production will over time tend to increase to match the stronger demand. However, unlike many products, where production can be increased and sustained in a matter of hours or days, increases in natural gas production involve much longer lead times. It takes time to acquire leases, secure required government permits, do exploratory seismic work, drill wells and connect wells to pipelines; this can take as little as 6 months, and in some cases up to ten years. There is also uncertainty about the geologic productivity of existing wells and planned new wells. Existing wells will naturally decline at some point of their productive life and the production profile over time is not known with certainty. Thus, it takes time to adjust supplies in the face of increasing demand and rising prices. To learn more about factors that affect the supply of natural gas, click here.
The supply response to prices was demonstrated emphatically following the winter of 2000-2001 as producers substantially increased production investments and activities in response to higher prices. Likewise higher prices (and the U.S. recession) also reduced demand for natural gas. The supply and demand responses led to a new equilibrium in 2002 between supply and demand at market clearing prices far below the 2000-2001 peak.
 |
| Source: NGSA |
In an environment of falling gas prices, the converse will be true. Producers will respond to lower natural gas prices over time by reducing their expenditures for new exploration and production. Production decline in existing wells will decrease productive capacity. At the same time, the lower prices will increase the demand for natural gas. This, in turn, will ultimately result in upward pressure on gas prices. This relationship between changes in the price of natural gas and variations in the supply of and demand for natural gas is sometimes referred to as the “natural gas market cycle.”
In the short term, and in relation to existing producing wells, the supply of natural gas is relatively inelastic in response to changes in the price of natural gas. Contrary to some views, producers do not routinely shut in wells when natural gas prices are low. There are several economic drivers that provide an incentive for producers to continue producing even in the face of lower prices.
- First, if production is halted from a natural gas well it may not be possible to restore the well’s production due to reservoir and wellbore characteristics.
- Second, the net present value of recapturing production in the future may be negative relative to producing the gas today — i.e., it may be better to produce gas today than to wait until the future to produce the gas. If a producer chooses not to operate a well, the lost production cannot be recovered the next month but is instead is deferred potentially years in the future. There are no guarantees that the prices for gas in the future are going to be higher than prices today.
- Third, some gas is produced in association with oil, and in order to stop the flow of natural gas, the oil production must be stopped as well, which may not be economic.
- Finally, a producer may be financially or contractually bound to produce specific volumes of natural gas.
Producers and consumers react rationally to changes in prices. Fluctuations in gas prices and production levels are a normal response of the competitive and liquid North America gas market. While the price of the natural gas commodity fluctuates, it is this inherent volatility that provides the signals (and incentives) to both suppliers and consumers to ensure a constant move towards supply and demand equality.
Because the natural gas market is so heavily dependent on the interaction of supply and demand, it is important to have knowledge of the factors that affect these two components. To learn more about the supply and demand of natural gas in the United States, click on the links below:
To learn more about natural gas as a commodity, click here.
To learn more about the pricing of natural gas in competitive markets, visit the International Energy Agency here.