Resources
How Much Natural Gas is There?
There is an abundance of natural gas in North America, but it is a non-renewable resource, the formation of which takes thousands and possibly millions of years. Therefore, understanding the availability of our supply of natural gas is important as we increase our use of this fossil fuel.
This section will provide a framework for understanding just how much natural gas there is in the ground available for our use, as well as links to the most recent statistics concerning the available supply of natural gas.
As natural gas is essentially irreplaceable (at least with current technology), it is important to have an idea of how much natural gas is left in the ground for us to use. However, this becomes complicated by the fact that no one really knows exactly how much natural gas exists until it is extracted. Measuring natural gas in the ground is no easy job, and it involves a great deal of inference and estimation. With new technologies, these estimates are becoming more and more reliable; however, they are still subject to revision.
A common misconception about natural gas is that we are running out, and quickly. However, this couldn’t be further from the truth. Many people believe that price spikes, such as were seen in the 1970’s, and in the early to mid-2000s, indicate that we are running out of natural gas. The two aforementioned periods of high prices were not caused by waning natural gas resources – rather, there were other forces at work in the marketplace. In fact, there is a vast amount of natural gas estimated to still be in the ground. In order to better understand exactly what these estimates mean, and their importance, it is useful first to learn a bit of industry terminology for the different types of estimates.
U.S. Natural Gas Resource Estimates
Below are three estimates of natural gas reserves in the United States. It is important to note that analysts use different methodologies and systems of classification in various estimates. There is no single way that every industry player quantifies estimates of natural gas. Therefore, it is important to delve into the assumptions and methodology behind each study to gain a complete understanding of the estimate itself. The first, compiled by the Energy Information Administration(referred to as the EIA), estimates that there are 2,543 trillion cubic feet (Tcf) of technically recoverable natural gas in the United States. This includes undiscovered, unproved, and unconventional natural gas. To learn more about these classifications, click here. As can be seen from the table, proved reserves make up a very small proportion of the total recoverable natural gas resources in the U.S. The most recent EIA data on proved reserves in the U.S. can be found here.
(Source: EIA Annual Energy Outlook 2011)
The following table includes an estimate of natural gas resources compiled by the National Petroleum Council in its 2007 report Facing the Hard Truths About Energy. In their study, the National Petroleum Council estimated there were 1,451 Tcf remaining in the U.S. According to this 2007 report, advances in technology could bring natural gas resources to 1,887 Tcf by 2017. Since then, natural gas resources have dramatically changed because of the ability to extract natural gas from shale rock found in more than 20 states in the U.S. The National Petroleum Council has undertaken an updated analysis of resources. This North American Resources Study was scheduled to be released in March of 2011 but is not yet available.

Below is an estimate for year-end 2010 completed by the Potential Gas Committee and released in April 2011. This estimate places total U.S. total production resources at 2,170 Tcf.
Mean Values, Tcf Change
Resource Category 2010 2008 Tcf (%)
Traditional Gas Resources:
Probable resources (current fields)…………………….. 536.6 441.4
Possible resources (new fields)…………………………. 687.7 736.9
Speculative resources (frontiers)………………………… 518.3 500.7
Total Traditional Gas Resources*…………………….. 1,739.2 1,673.4 +66.7 (3.9%)
Coalbed Gas Resources:
Probable resources………………………………………….. 13.4 14.2
Possible resources………………………………………….. 48.1 49.8
Speculative resources………………………………………. 96.2 98.9
Total Coalbed Gas Resources*…………………………. 158.6 163.0 –4.4 (–2.7%)
Grand Total Potential Resources**………………. 1,897.8 1,836.4 +61.4 (3.3%)
Proved dry-gas reserves (DOE/EIA)…………………………. 272.5† 244.7
U.S. Future Gas Supply …………………………….. 2,170.3 2,081.1 +89.2 (4.3%)
Source: http://www.potentialgas.org
In addition to the three estimates above, there are a myriad of different industry participants that formulate their own estimates regarding natural gas supplies. While this leads to a wealth of information, it also leads to a number of difficulties. Each estimate is based on a different set of assumptions, completed with different tools and even referred to with different language. It is thus difficult to get a definitive answer to the question of how much natural gas exists. In addition, since these are all essentially educated guesses as to the amount of natural gas in the earth, there are constant revisions being made. New technology, combined with increased knowledge of particular areas and reservoirs mean that these estimates are in a constant state of flux. Further complicating the scenario is the fact that there are no universally accepted definitions for the terms that are used differently by geologists, engineers, accountants, and others.
 |
| Source: Energy Information Aministration |
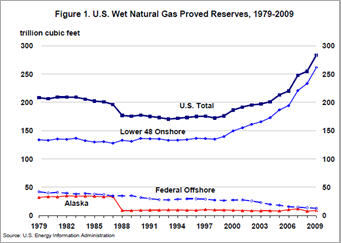
Historical Proved Natural Gas Reserves
The graph, using data recorded by EIA shows the change in proved natural gas reserves in the United States from 1979 to 2009. As can be seen, the levels of proved reserves in the United States have changed significantly over the past 10 years. If the additions to proved reserves in a given year are larger than the subtractions from production, then proved reserves will increase, and vice versa. Usually, however, the additions are close enough to the subtractions to maintain a relatively constant level of proved reserves. For the most recent reserve statistics, including more in depth-analysis, click here to visit the EIA’s website.
Where Are These Reserves?
 |
| Source: EIA |
Most of the natural gas that is found in North America is concentrated in relatively distinct geographical areas, or basins. Given this distribution of natural gas deposits, those states which are located on top of a major basin have the highest level of natural gas reserves. As can be seen from the map below, U.S. natural gas reserves historically have been concentrated around Texas and the Gulf of Mexico. With the recent onset of shale production the number of states across the U.S with significant resources has increased, with major shale gas producing states including New York, Pennsylvania, Arkansas and Oklahoma, as well as Texas and Louisiana. For more information about the importance and size of shale gas, please visit the shale section.
The map to the right gives a general impression of where most of the proved natural gas resources are in the United States. Visit the EIA for more in-depth analysis into natural gas reserves across the country and to access geographical natural gas data.
 World Natural Gas Reserves
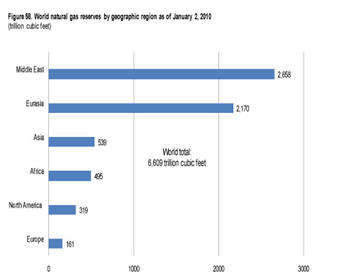
The EIA, in conjunction with the Oil and Gas Journal and World Oil publications, estimates world proved natural gas reserves to be around 6,609 Tcf. As can be seen from the graph, most of these reserves are located in the Middle East with 2,658 Tcf, or 40 percent of the world total, and Europe and the Former U.S.S.R. with 2,331, or 35 percent of total world reserves. The United States, by this calculation, possesses slightly over 4 percent of the world total natural gas reserves.
| Source: International Energy 2010 – EIA |
For more information on international natural gas reserves, visit the EIA’sinternational data section.
Now that the methods of reserve estimation and the most recent data concerning North America and the world’s supply of natural gas have been discussed, proceed to learn about the many uses of this vital gas.