Exploration

The practice of locating natural gas and petroleum deposits has been transformed dramatically in the last 20 years with the advent of extremely advanced, ingenious technology. In the early days of the industry, the only way of locating underground petroleum and natural gas deposits was to search for surface evidence of these underground formations. Those searching for natural gas deposits were forced to scour the earth, looking for seepages of oil or gas emitted from underground before they had any clue that there were deposits underneath. However, because such a low proportion of petroleum and natural gas deposits actually seep to the surface, this made for a very inefficient and difficult exploration process. As the demand for fossil fuel energy has increased dramatically over the past years, so has the necessity for more accurate methods of locating these deposits.
Sources of Data
Technology has allowed for a remarkable increase in the success rate of locating natural gas reservoirs. In this section, it will be outlined how geologists and geophysicists use technology and knowledge of the properties of underground natural gas deposits to gather data that can later be interpreted and used to make educated guesses as to where natural gas deposits exist. However, it must be remembered that the process of exploring for natural gas and petroleum deposits is characteristically an uncertain one, due to the complexity of searching for something that is often thousands of feet below ground.
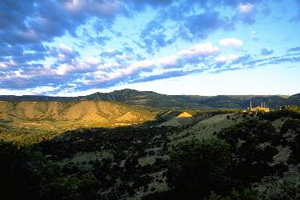
Exploration for natural gas typically begins with geologists examining the surface structure of the earth, and determining areas where it is geologically likely that petroleum or gas deposits might exist. It was discovered in the mid 1800s that ‘anticlinal slopes’ had a particularly increased chance of containing petroleum or gas deposits. These anticlinal slopes are areas where the earth has folded up on itself, forming the dome shape that is characteristic of a great number of reservoirs. By surveying and mapping the surface and sub-surface characteristics of a certain area, the geologist can extrapolate which areas are most likely to contain a petroleum or natural gas reservoir. The geologist has many tools at his disposal to do so, from the outcroppings of rocks on the surface or in valleys and gorges, to the geologic information attained from the rock cuttings and samples obtained from the digging of irrigation ditches, water wells, and other oil and gas wells. This information is all combined to allow the geologist to make inferences as to the fluid content, porosity, permeability, age, and formation sequence of the rocks underneath the surface of a particular area. For example, in the picture shown, a geologist may study the outcroppings of rock to gain insight into the geology of the subsurface areas.
For more information on geology in general visit the United States Geological Survey. For more information on petroleum geology visit the American Association of Petroleum Geologists (AAPG).
Once the geologist has determined an area where it is geologically possible for a natural gas or petroleum formation to exist, further tests can be performed to gain more detailed data about the potential reservoir area. These tests allow for the more accurate mapping of underground formations, most notably those formations that are commonly associated with natural gas and petroleum reservoirs. These tests are commonly performed by a geophysicist, one who uses technology to find and map underground rock formations.
Arguably the biggest breakthrough in petroleum and natural gas exploration came through the use of basic seismology. Seismology refers to the study of how energy, in the form of seismic waves, moves through the Earth’s crust and interacts differently with various types of underground formations. In 1855, L. Palmiere developed the first ‘seismograph’, an instrument used to detect and record earthquakes. This device was able to pick up and record the vibrations of the earth that occur during an earthquake. However, it wasn’t until 1921 that this technology was applied to the petroleum industry and used to help locate underground fossil fuel formations.

The basic concept of seismology is quite simple. As the Earth’s crust is composed of different layers, each with its own properties, energy (in the form of seismic waves) traveling underground interacts differently with each of these layers. These seismic waves, emitted from a source, will travel through the earth, but also be reflected back toward the source by the different underground layers. Through seismology, geophysicists are able to artificially create vibrations on the surface and record how these vibrations are reflected back to the surface, revealing the properties of the geology beneath.
An analogy that makes intuitive sense is that of bouncing a rubber ball. A rubber ball that is dropped on concrete will bounce in a much different way than a rubber ball dropped on sand. In the same manner, seismic waves sent underground will reflect off dense layers of rock much differently than extremely porous layers of rock, allowing the geologist to infer from seismic data exactly what layers exist underground and at what depth. While the actual use of seismology in practice is quite a bit more complicated and technical, this basic concept still holds.
Here is a more detailed overview of seismic exploration.
Onshore Seismology
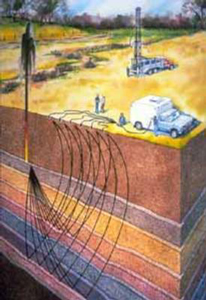
In practice, using seismology for exploring onshore areas involves artificially creating seismic waves, the reflection of which are then picked up by sensitive pieces of equipment called ‘geophones’ that are embedded in the ground. The data picked up by these geophones is then transmitted to a seismic recording truck, which records the data for further interpretation by geophysicists and petroleum reservoir engineers. The drawing shows the basic components of a seismic crew. The source of seismic waves (in this case an underground explosion) creates that reflect off the different layers of the Earth, to be picked up by geophones on the surface and relayed to a seismic recording truck to be interpreted and logged.
Although the seismograph was originally developed to measure earthquakes, it was discovered that much the same sort of vibrations and seismic waves could be produced artificially and used to map underground geologic formations. In the early days of seismic exploration, seismic waves were
created using dynamite. These carefully planned, small explosions created the requisite seismic waves, which were then picked up by the geophones, generating data to be interpreted by geophysicists, geologists, and petroleum engineers.
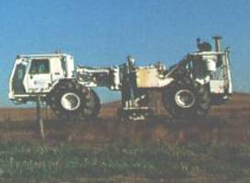
Recently, due to environmental concerns and improved technology, it is often no longer necessary to use explosive charges to generate the needed seismic waves. Instead, most seismic crews use non-explosive seismic technology to generate the required data. This non-explosive technology usually consists of a large heavy-wheeled or tracked-vehicle carrying special equipment designed to create a large impact or series of vibrations. These impacts or vibrations create seismic waves similar to those created by dynamite. In the seismic truck shown, the large piston in the middle is used to create vibrations on the surface of the earth, sending seismic waves that are used to generate useful data.
Offshore Seismology
The same sort of process is used in offshore seismic exploration. When exploring for natural gas that may exist thousands of feet below the seabed floor, which may itself be thousands of feet below sea level, a slightly different method of seismic exploration is used. Instead of trucks and geophones, a ship is used to pick up the seismic data and hydrophones are used to pick up seismic waves underwater. These hydrophones are towed behind the ship in various configurations depending on the needs of the geophysicist. Instead of using dynamite or impacts on the seabed floor, the seismic ship uses a large air gun, which releases bursts of compressed air under the water, creating seismic waves that can travel through the Earth’s crust and generate the seismic reflections that are necessary.
Magnetometers
In addition to using seismology to gather data concerning the composition of the Earth’s crust, the magnetic properties of underground formations can be measured to generate geological and geophysical data. This is accomplished through the use of magnetometers, which are devices that can measure the small differences in the Earth’s magnetic field. In the early days of magnetometers, the devices were large and bulky, and only able to survey a small area at a time.
Gravimeters
In addition to using variances in the Earth’s magnetic field, geophysicists can also measure and record the difference in the Earth’s gravitational field to gain a better understanding of what is underground. Different underground formations and rock types all have a slightly different effect on the gravitational field that surrounds the Earth. By measuring these minute differences with very sensitive equipment, geophysicists are able to analyze underground formations and develop clearer insight into the types of formations that may lie below ground, and whether or not the formations have the potential for containing hydrocarbons like natural gas.
Exploratory Wells
The best way to gain a full understanding of subsurface geology and the potential for natural gas deposits to exist in a given area is to drill an exploratory well. This consists of digging into the Earth’s crust to allow geologists to study the composition of the underground rock layers in detail. In addition to looking for natural gas and petroleum deposits by drilling an exploratory well, geologists also examine the drill cuttings and fluids to gain a better understanding of the geologic features of the area. Logging, explained below, is another tool used in developed as well as exploratory wells. Drilling an exploratory well is an expensive, time consuming effort. Therefore, exploratory wells are only drilled in areas where other data has indicated a high probability of petroleum formations. For more information on the process of drilling natural gas wells, click here.
Logging
Logging refers to performing tests during or after the drilling process to allow geologists and drill operators to monitor the progress of the well drilling and to gain a clearer picture of subsurface formations. There are many different types of logging, in fact; over 100 different logging tests can be performed, but essentially they consist of a variety of tests that illuminate the true composition and characteristics of the different layers of rock that the well passes through. Logging is also essential during the drilling process. Monitoring logs can ensure that the correct drilling equipment is used and that drilling is not continued if unfavorable conditions develop.
It is beyond the scope of this website to get into detail concerning the various types of logging tests that can be performed. Various types of tests include standard, electric, acoustic, radioactivity, density, induction, caliper, directional and nuclear logging, to name but a few. Two of the most prolific and often performed tests include standard logging and electric logging.
Standard logging consists of examining and recording the physical aspects of a well. For example, the drill cuttings (pieces of rock displaced by the drilling of the well) are all examined and recorded, allowing geologists to physically examine the subsurface rock. Also, core samples are taken by lifting a sample of underground rock intact to the surface, allowing the various layers of rock and their thickness to be examined. These cuttings and cores are often examined using powerful microscopes that can magnify the rock up to 2,000 times. This allows the geologist to examine the porosity and fluid content of the subsurface rock, and to gain a better understanding of the earth in which the well is being drilled.
Electric logging consists of lowering a device used to measure the electric resistance of the rock layers in the ‘down hole’ portion of the well. This is done by running an electric current through the rock formation and measuring the resistance that it encounters along its way. This gives geologists an idea of the fluid content and characteristics. A newer version of electric logging, called induction electric logging, provides much the same types of readings, but is more easily performed and provides data that is more easily interpreted.
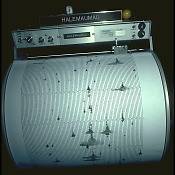
An example of the data obtained through various forms of logging is shown below. In this representation, the different columns indicate the results of different types of tests. The data is interpreted by an experienced geologist, geophysicist, or petroleum engineer, who is able to learn from what appear as ‘squiggly’ lines on the well data readout.
The drilling of an exploratory or developing well is the first contact that a geologist or petroleum engineer has with the actual contents of the subsurface geology. Logging, in its many forms, uses this opportunity to gain a fuller understanding of what actually lies beneath the surface. In addition to providing information specific to that particular well, vast archives of historical logs exist for geologists interested in the geologic features of a given or similar area.
To get more in-depth and technical information on well logging, click here.
Data Interpretation
There are many sources of data and information for the geologist and geophysicist to use in the exploration for hydrocarbons. However, this raw data alone would be useless without careful and methodical interpretation. Much like putting together a puzzle, the geophysicist uses all of the sources of data available to create a model, or educated guess, as to the structure of the layers of rock under the ground. Some techniques, including seismic exploration, lend themselves well to the construction of a hand- or computer-generated visual interpretation of an underground formation. Other sources of data, such as that obtained from core samples or logging, are taken into account by the geologist when determining the subsurface geological structures. Despite the amazing evolution of technology and exploration techniques, the only way of being sure that a petroleum or natural gas reservoir exists is to drill an exploratory well. Geologists and geophysicists can make their best guesses as to the location of reservoirs, but these are not infallible.
2-D Seismic Interpretation
Two-dimensional seismic imaging refers to geophysicists using the data collected from seismic exploration activities to develop a cross-sectional picture of the underground rock formations. The geophysicist interprets the seismic data obtained from the field, taking the vibration recordings of the seismograph and using them to develop a conceptual model of the composition and thickness of the various layers of rock underground. This process is normally used to map underground formations, and to make estimates based on the geologic structures to determine where it is likely that deposits may exist.
Another technique using basic seismic data is known as ‘direct detection.’ In the mid-1970s, it was discovered that white bands, called ‘bright spots’, often appeared on seismic recording strips. These white bands could indicate deposits of hydrocarbons. The nature of porous rock that contains natural gas could often result in reflecting stronger seismic reflections than normal, water-filled rock. Therefore, in these circumstances, the actual natural gas reservoir could be detected directly from the seismic data. However, this does not hold universally. Many of these ‘bright spots’ do not contain hydrocarbons, and many deposits of hydrocarbons are not indicated by white strips on the seismic data. Therefore, although adding a new technique of locating petroleum and natural gas reservoirs, direct detection is not a completely reliable method.
Computer Assisted Exploration
One of the greatest innovations in the history of petroleum exploration is the use of computers to compile and assemble geologic data into a coherent ‘map’ of the underground. Use of this computer technology is referred to as ‘CAEX’, which is short for ‘computer assisted exploration’.
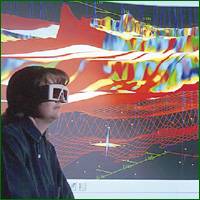
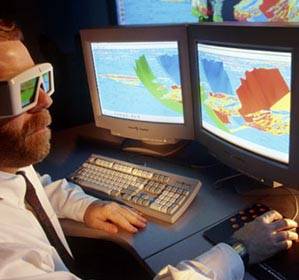
With the development of the microprocessor, it has become relatively easy to use computers to assemble seismic data that is collected from the field. This allows for the processing of very large amounts of data, increasing the reliability and informational content of the seismic model. There are three main types of computer-assisted exploration models: two-dimensional (2-D), three-dimensional (3-D), and most recently, four-dimensional (4-D). These imaging techniques, while relying mainly on seismic data acquired in the field, are becoming more and more sophisticated. Computer technology has advanced so far that it is now possible to incorporate the data obtained from different types of tests, such as logging, production information, and gravimetric testing, which can all be combined to create a ‘visualization’ of the underground formation. Thus geologists and geophysicists are able to combine all of their sources of data to compile one clear, complete image of subsurface geology. An example of this is shown where a geologist uses an interactive computer generated visualization of 3-D seismic data to explore the subsurface layers.
3-D Seismic Imaging
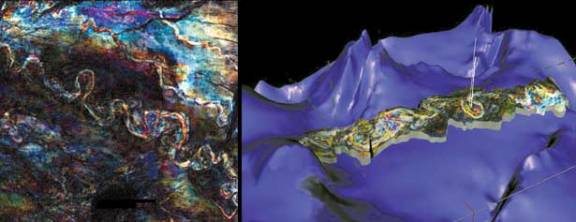
One of the biggest breakthroughs in computer-aided exploration was the development of three-dimensional (3-D) seismic imaging. Three-D imaging utilizes seismic field data to generate a three dimensional ‘picture’ of underground formations and geologic features. This, in essence, allows the geophysicist and geologist to see a clear picture of the composition of the Earth’s crust in a particular area. This is tremendously useful in allowing for the exploration of petroleum and natural gas, as an actual image could be used to estimate the probability of formations existing in a particular area, and the characteristics of that potential formation. This technology has been extremely successful in raising the success rate of exploration efforts. In fact, using 3-D seismic has been estimated to increase the likelihood of successful reservoir location by 50 percent.
Although this technology is very useful, it is also very costly. Three-D seismic imaging can cost hundreds of thousands of dollars per square mile. The generation of 3-D images requires data to be collected from several thousand locations, as opposed to 2-D imaging, which only requires several hundred data points. As such, 3-D imaging is a much more involved and prolonged process. Therefore, it is usually used in conjunction with other exploration techniques. For example, a geophysicist may use traditional 2-D modeling and examination of geologic features to determine if there is a probability of the presence of natural gas. Once these basic techniques are used, 3-D seismic imaging may be used only in those areas that have a high probability of containing reservoirs.
In addition to broadly locating petroleum reservoirs, 3-D seismic imaging allows for the more accurate placement of wells to be drilled. This increases the productivity of successful wells, allowing for more petroleum and natural gas to be extracted from the ground. In fact, 3-D seismic can increase the recovery rates of productive wells to 40-50 percent, as opposed to 25-30 percent with traditional 2-D exploration techniques.
In addition to broadly locating petroleum reservoirs, 3-D seismic imaging allows for the more accurate placement of wells to be drilled. This increases the productivity of successful wells, allowing for more petroleum and natural gas to be extracted from the ground. In fact, 3-D seismic can increase the recovery rates of productive wells to 40 to 50 percent or greater, as opposed to 25 to 30 percent with traditional 2-D exploration techniques.
Three-D seismic imaging has become an extremely important tool in the search natural gas. By 1980, only 100 3-D seismic imaging tests had been performed. However, by the mid 1990s, 200 to 300 3-D seismic surveys were being performed each year. In 1996, in the Gulf of Mexico, one of the largest natural gas-producing areas in the U.S., nearly 80 percent of wells drilled in the Gulf were based on 3-D seismic data. In 1993, 75 percent of all onshore exploratory surveys conducted used 3-D seismic imaging.
2-D Seismic Imaging
Two-dimensional (2-D) computer-assisted exploration includes generating an image of subsurface geology much in the same manner as in normal 2-D data interpretation. However, with the aid of computer technology, it is possible to generate more detailed maps more quickly than by the traditional method. In addition, with 2-D CAEX it is possible to use color graphic displays generated by a computer to highlight geologic features that may not be apparent using traditional 2-D seismic imaging methods.
While 2-D seismic imaging is less complicated and less detailed than 3-D imaging, it must be noted that 3-D imaging techniques were developed prior to 2-D techniques. Thus, although it does not appear to be the logical progression of techniques, the simpler 2-D imaging techniques were actually an extension of 3-D techniques, not the other way around. Because it is simpler, 2-D imaging is much cheaper, and more easily and quickly performed, than 3-D imaging. Because of this, 2-D CAEX imaging may be used in areas that are somewhat likely to contain natural gas deposits, but not likely enough to justify the full cost and time commitment required by 3-D imaging.
4-D Seismic Imaging

One of the latest breakthroughs in seismic exploration and the modeling of underground rock formations has been the introduction of four-dimensional (4-D) seismic imaging. This type of imaging is an extension of 3-D imaging technology. However, instead of achieving a simple, static image of the underground, in 4-D imaging the changes in structures and properties of underground formations are observed over time. Since the fourth dimension in 4-D imaging is time, it is also referred to as 4-D ‘time lapse’ imaging.
Various seismic readings of a particular area are taken at different times, and this sequence of data is fed into a powerful computer. The different images are amalgamated to create a ‘movie’ of what is going on under the ground. By studying how seismic images change over time, geologists can gain a better understanding of many properties of the rock, including underground fluid flow, viscosity, temperature and saturation. Although very important in the exploration process, 4-D seismic images can also be used by petroleum geologists to evaluate the properties of a reservoir, including how it is expected to deplete once petroleum extraction has begun. Using 4-D imaging on a reservoir can increase recovery rates above what can be achieved using 2-D or 3-D imaging. Where the recovery rates using these two types of images are 25 to 30 percent and 40 to 50 percent respectively, the use of 4-D imaging can result in recovery rates of 65 to 70 percent.
Now that we have taken a look at how natural gas deposits are found, the next step in the natural gas line is the process of extraction. Click here to learn how natural gas is taken out of the Earth and brought to the surface.