Market Activity
Transparency in any market is critical to its overall health and efficiency and enables competition to benefit customers. Electronic trading and the reporting of certain natural gas commodity prices to index publishers is how natural gas markets maintain transparency and foster reliable price discovery.
During the past several years, the natural gas industry, index publishers and the Federal Energy Regulatory Commission (FERC) have worked together to come up with voluntary discovery process to improve transparency and to further ensure market confidence.
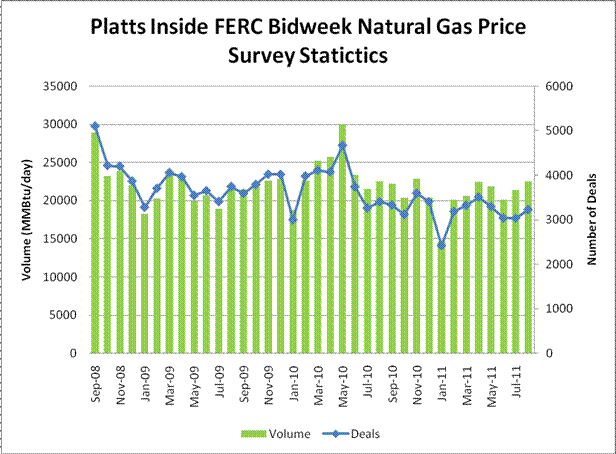
This section reflects a compilation of publicly available market activity trends from one or more natural gas index publishers and trading platforms. This page is updated frequently to provide a one-stop-repository for charts and developments. Click on the publisher/exchange’s name to go to its site.
|
Month |
Volume(Million MMBtu) |
Deals |
Tier 1 Points |
Tier 2 Points |
Tier 3 Points |
|
Jan-07 |
16.99 |
2,574 |
39 |
11 |
12 |
|
Feb-07 |
20.52 |
3,390 |
43 |
13 |
6 |
|
Mar-07 |
25.00 |
4,050 |
46 |
11 |
5 |
|
Apr-07 |
21.68 |
3,489 |
49 |
9 |
5 |
|
May-07 |
20.69 |
3,322 |
48 |
11 |
4 |
|
Jun-07 |
24.00 |
3,811 |
43 |
11 |
9 |
|
Jul-07 |
22.72 |
3,586 |
44 |
14 |
5 |
|
Aug-07 |
20.01 |
3,435 |
42 |
18 |
5 |
|
Sep-07 |
23.67 |
3,901 |
47 |
16 |
2 |
|
Oct-07 |
25.69 |
4,142 |
50 |
14 |
2 |
|
Nov-07 |
25.30 |
4,080 |
47 |
15 |
4 |
|
Dec-07 |
27.61 |
4,461 |
49 |
12 |
5 |
|
Jan-08 |
20.17 |
3,232 |
44 |
15 |
6 |
|
Feb-08 |
22.90 |
3,782 |
47 |
14 |
5 |
|
Mar-08 |
27.24 |
4,405 |
49 |
12 |
5 |
|
Apr-08 |
26.47 |
4,344 |
50 |
13 |
2 |
|
May-08 |
29.88 |
4,602 |
50 |
13 |
2 |
|
Jun-08 |
26.28 |
4,334 |
51 |
10 |
5 |
|
Jul-08 |
28.67 |
4,871 |
50 |
11 |
5 |
|
Aug-08 |
29.03 |
5,135 |
53 |
10 |
3 |
|
Sep-08 |
28.92 |
5,100 |
51 |
13 |
3 |
|
Oct-08 |
23.22 |
4,216 |
48 |
12 |
7 |
|
Nov-08 |
23.85 |
4,200 |
53 |
11 |
3 |
|
Dec-08 |
22.05 |
3,864 |
49 |
16 |
3 |
|
Jan-09 |
18.24 |
3,278 |
48 |
15 |
4 |
|
Feb-09 |
20.31 |
3,703 |
53 |
13 |
2 |
|
Mar-09 |
23.60 |
4,054 |
55 |
11 |
2 |
|
Apr-09 |
22.87 |
3,960 |
54 |
11 |
3 |
|
May-09 |
19.92 |
3,542 |
50 |
16 |
2 |
|
Jun-09 |
20.73 |
3,650 |
49 |
15 |
4 |
|
Jul-09 |
18.91 |
3,405 |
52 |
13 |
6 |
|
Aug-09 |
21.34 |
3,741 |
55 |
11 |
5 |
|
Sep-09 |
21.49 |
3,586 |
51 |
14 |
5 |
|
Oct-09 |
22.36 |
3,791 |
51 |
12 |
7 |
|
Nov-09 |
22.65 |
4,015 |
56 |
11 |
2 |
|
Dec-09 |
22.91 |
4,015 |
55 |
13 |
2 |
|
Jan-10 |
18.77 |
2,996 |
49 |
15 |
7 |
|
Feb-10 |
22.65 |
3,978 |
55 |
12 |
4 |
|
Mar-10 |
25.20 |
4,109 |
59 |
8 |
3 |
|
Apr-10 |
25.75 |
4,071 |
53 |
12 |
5 |
|
May-10 |
30.04 |
4,671 |
55 |
13 |
2 |
|
Jun-10 |
23.34 |
3,738 |
53 |
13 |
4 |
|
Jul-10 |
21.51 |
3,259 |
51 |
16 |
3 |
|
Aug-10 |
22.52 |
3,403 |
56 |
13 |
4 |
|
Sep-10 |
22.22 |
3,326 |
57 |
12 |
4 |
|
Oct-10 |
20.34 |
3,115 |
51 |
18 |
4 |
|
Nov-11 |
22.91 |
3,595 |
54 |
14 |
5 |
|
Dec-10 |
20.34 |
3,405 |
52 |
15 |
6 |
|
Jan-11 |
14.66 |
2,418 |
38 |
21 |
13 |
|
Feb-11 |
20.08 |
3,183 |
47 |
20 |
6 |
|
Mar-11 |
20.62 |
3,324 |
49 |
18 |
5 |
|
Apr-11 |
22.46 |
3,509 |
49 |
16 |
7 |
|
May-11 |
21.87 |
3,292 |
54 |
14 |
4 |
|
Jun-11 |
20.14 |
3,027 |
50 |
17 |
7 |
|
Jul-11 |
21.35 |
3,035 |
47 |
17 |
9 |
|
Aug-11 |
22.51 |
3,224 |
54 |
17 |
4 |
Note: Last updated August, 2011. Platts’ monthly survey covered 70 pricing locations until Aug. 1, 2004, when seven typically inactive points were deleted. Tier counts do not include points for which no assessment is made in a month because of insufficient market information. Platts in 2003 began grouping pricing points in its monthly gas survey into three tiers: tier 1, volumes of at least 100,000 MMBtu/day and at least 10 trades; tier 2, volumes of 25,000 to 99,999 MMBtu/day and at least five trades; and tier 3, volumes below 25,000 MMBtu/day and/or fewer than five trades. As of August 2004, Platts publishes volumes and number of transactions for points in tiers 1 and 2.
For more information, contact Brian Jordan at (202) 383-2181.
